Recreation from source (15 pages) — rendered images with extracted text. Editable original via the source link above.

1 How to: Fly Synapse Table of Contents: Indicators Shapes Vesicles Synaptic Clefts/Gaps T Bars Postsynaptic Density Tracing Method Top-Down/Surfacing synapses Indicators ● Synapses have four possible indicators: one primary, and three secondary. ○ Dense cluster of vesicles ○ Synaptic cleft ○ T-bar ○ PSD ● For a synapse to be vetted, the primary indicator (i.e. dense vesicles) must be present, as well at least two of the secondary indicators. ● What follows is a how-to guide on how to recognize and annotate synapses in fly data.

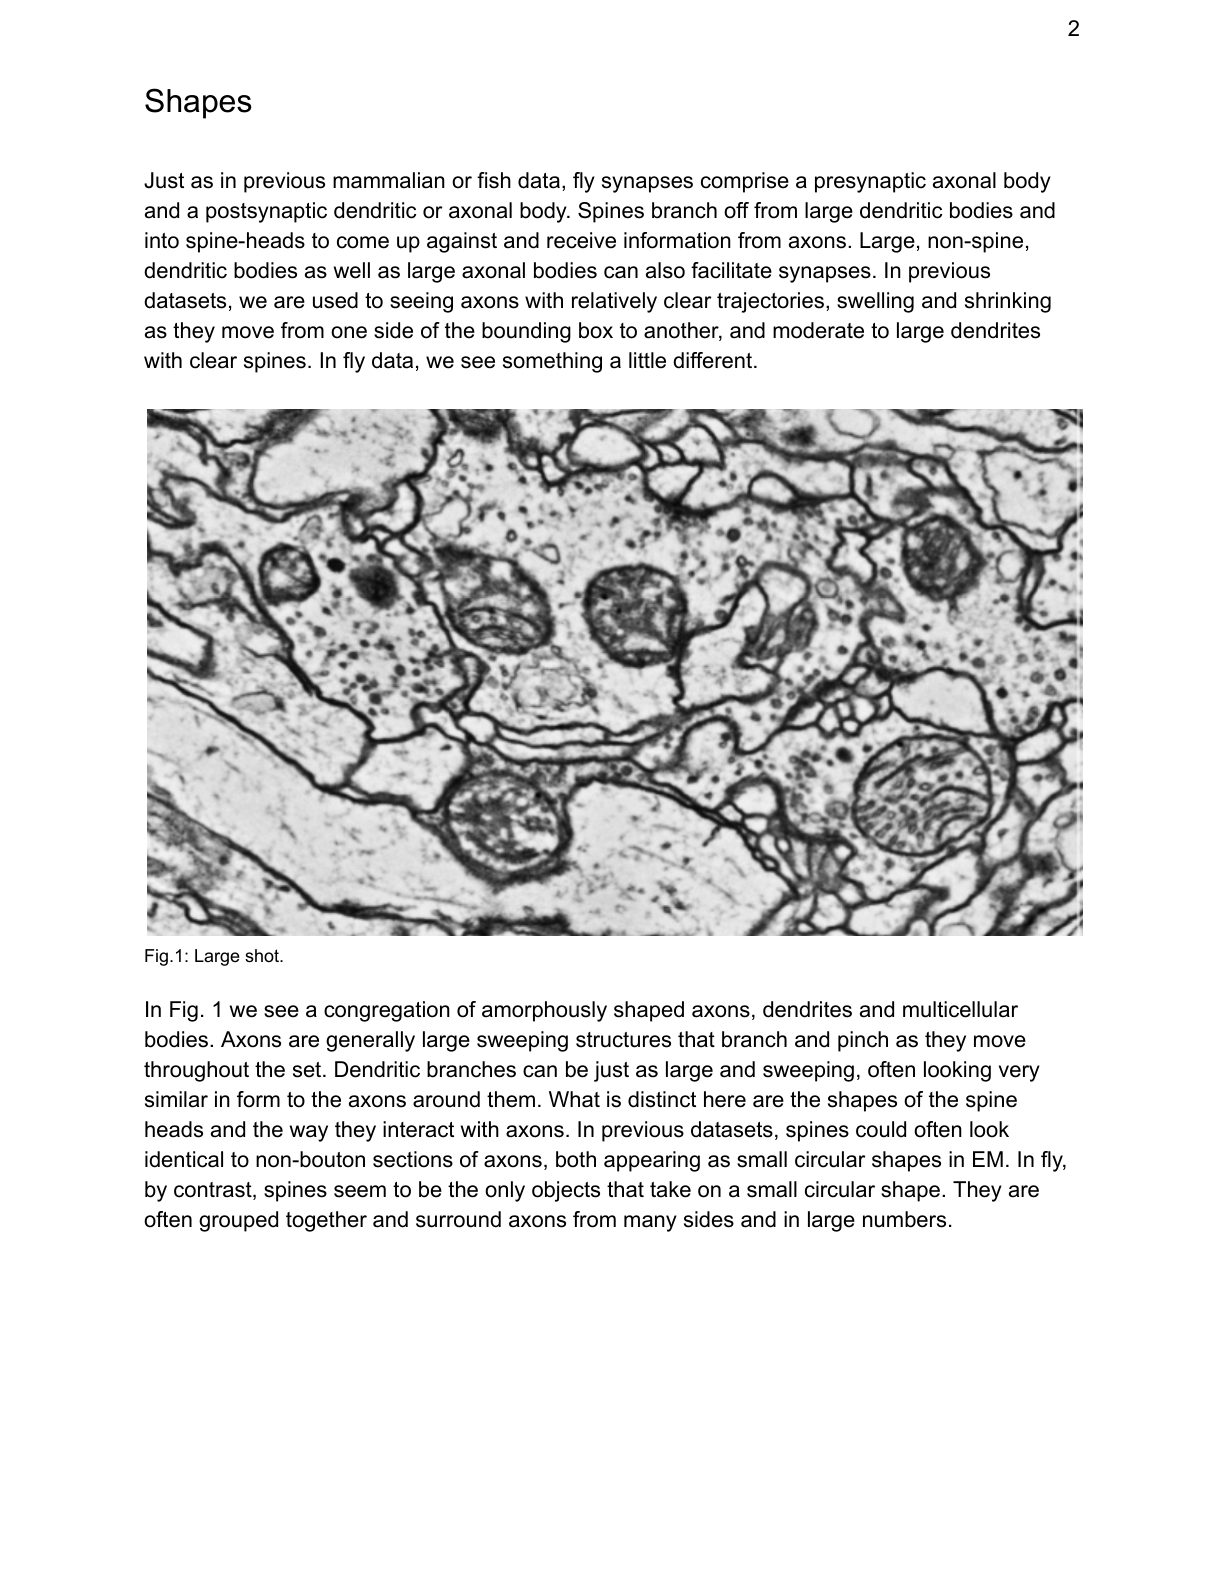
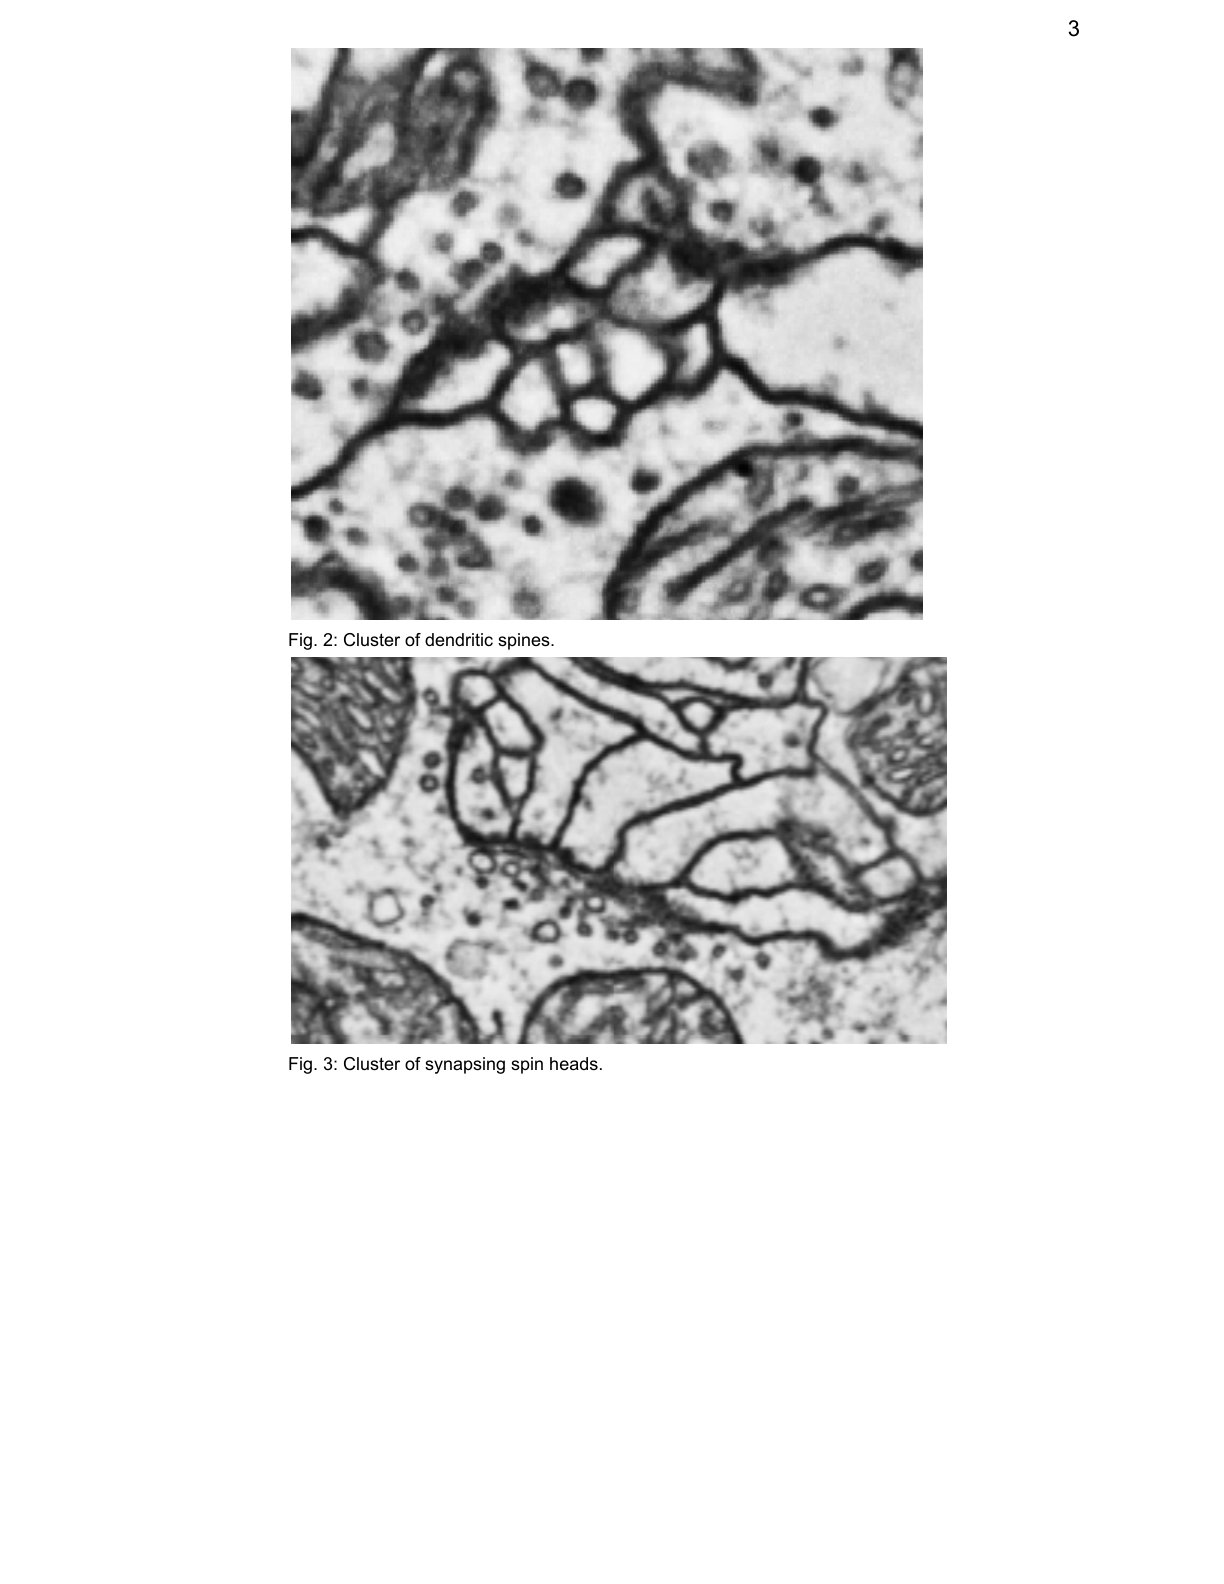
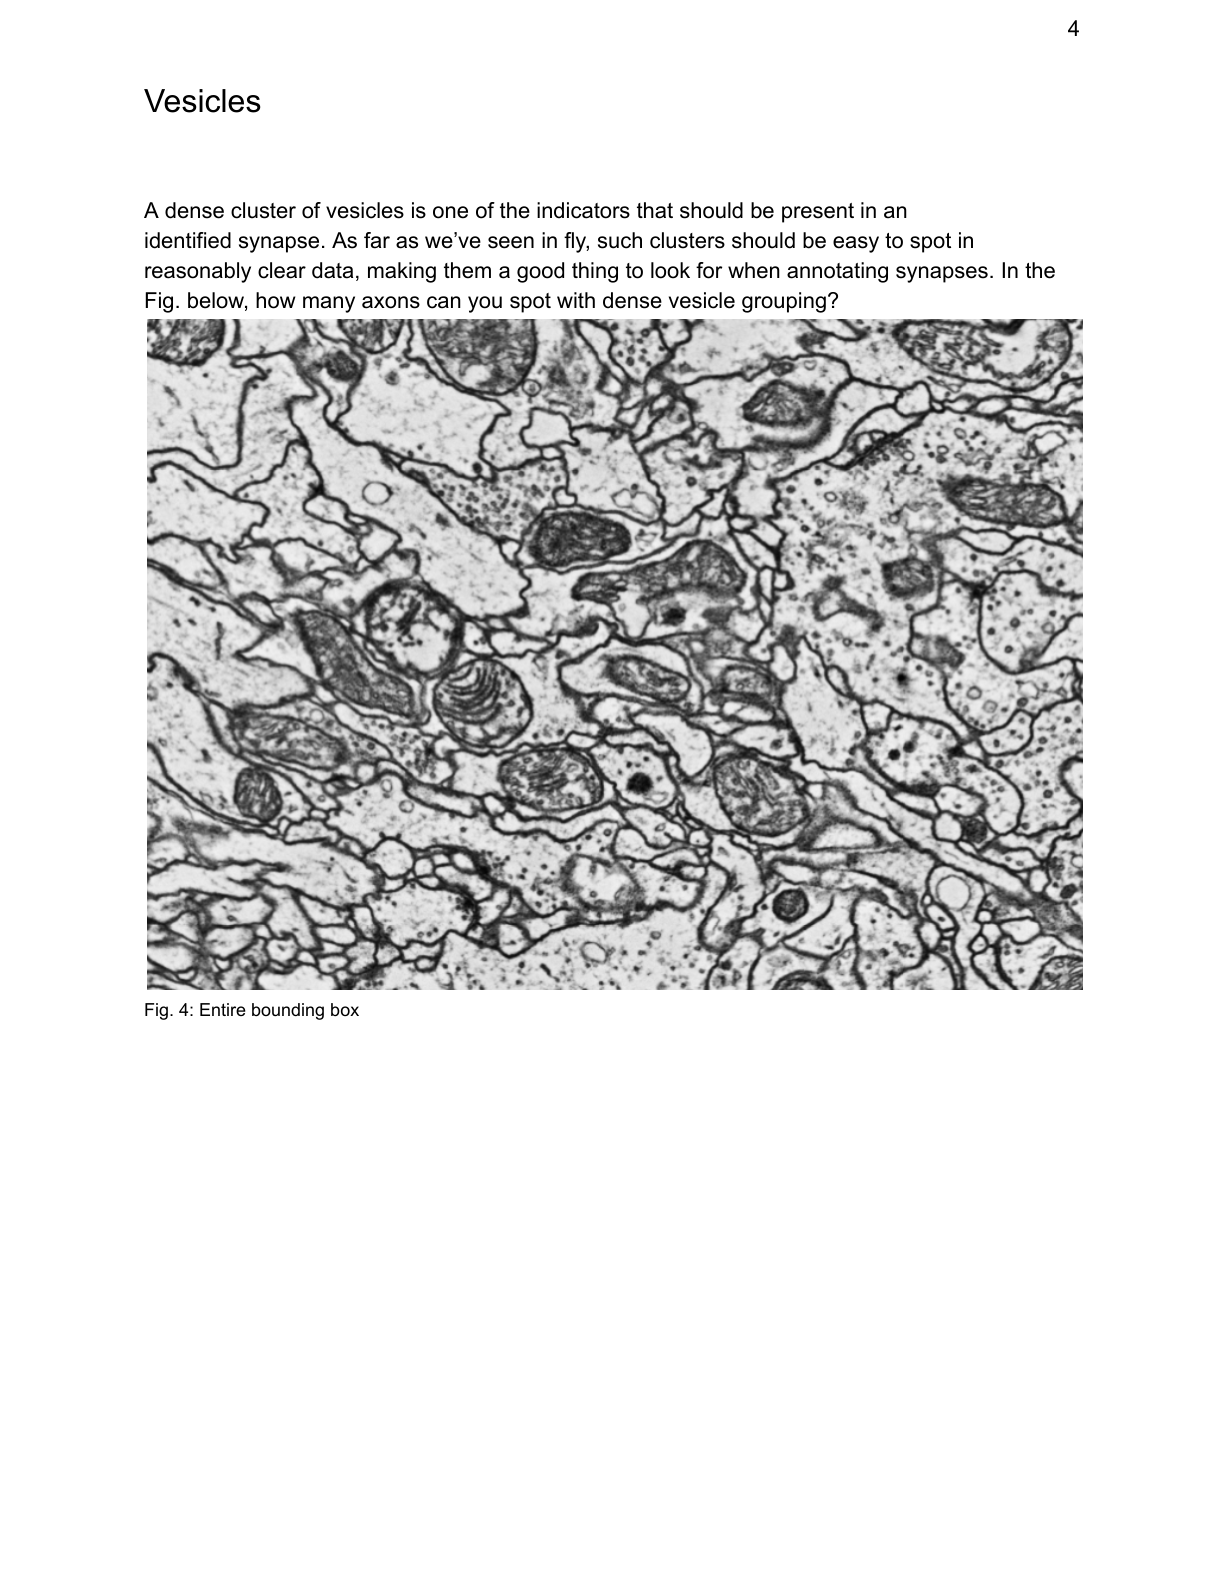
2 Shapes Just as in previous mammalian or fish data, fly synapses comprise a presynaptic axonal body and a postsynaptic dendritic or axonal body. Spines branch off from large dendritic bodies and into spine-heads to come up against and receive information from axons. Large, non-spine, dendritic bodies as well as large axonal bodies can also facilitate synapses. In previous datasets, we are used to seeing axons with relatively clear trajectories, swelling and shrinking as they move from one side of the bounding box to another, and moderate to large dendrites with clear spines. In fly data, we see something a little different. Fig.1: Large shot. In Fig. 1 we see a congregation of amorphously shaped axons, dendrites and multicellular bodies. Axons are generally large sweeping structures that branch and pinch as they move throughout the set. Dendritic branches can be just as large and sweeping, often looking very similar in form to the axons around them. What is distinct here are the shapes of the spine heads and the way they interact with axons. In previous datasets, spines could often look identical to non-bouton sections of axons, both appearing as small circular shapes in EM. In fly, by contrast, spines seem to be the only objects that take on a small circular shape. They are often grouped together and surround axons from many sides and in large numbers.
3 Fig. 2: Cluster of dendritic spines. Fig. 3: Cluster of synapsing spin heads.

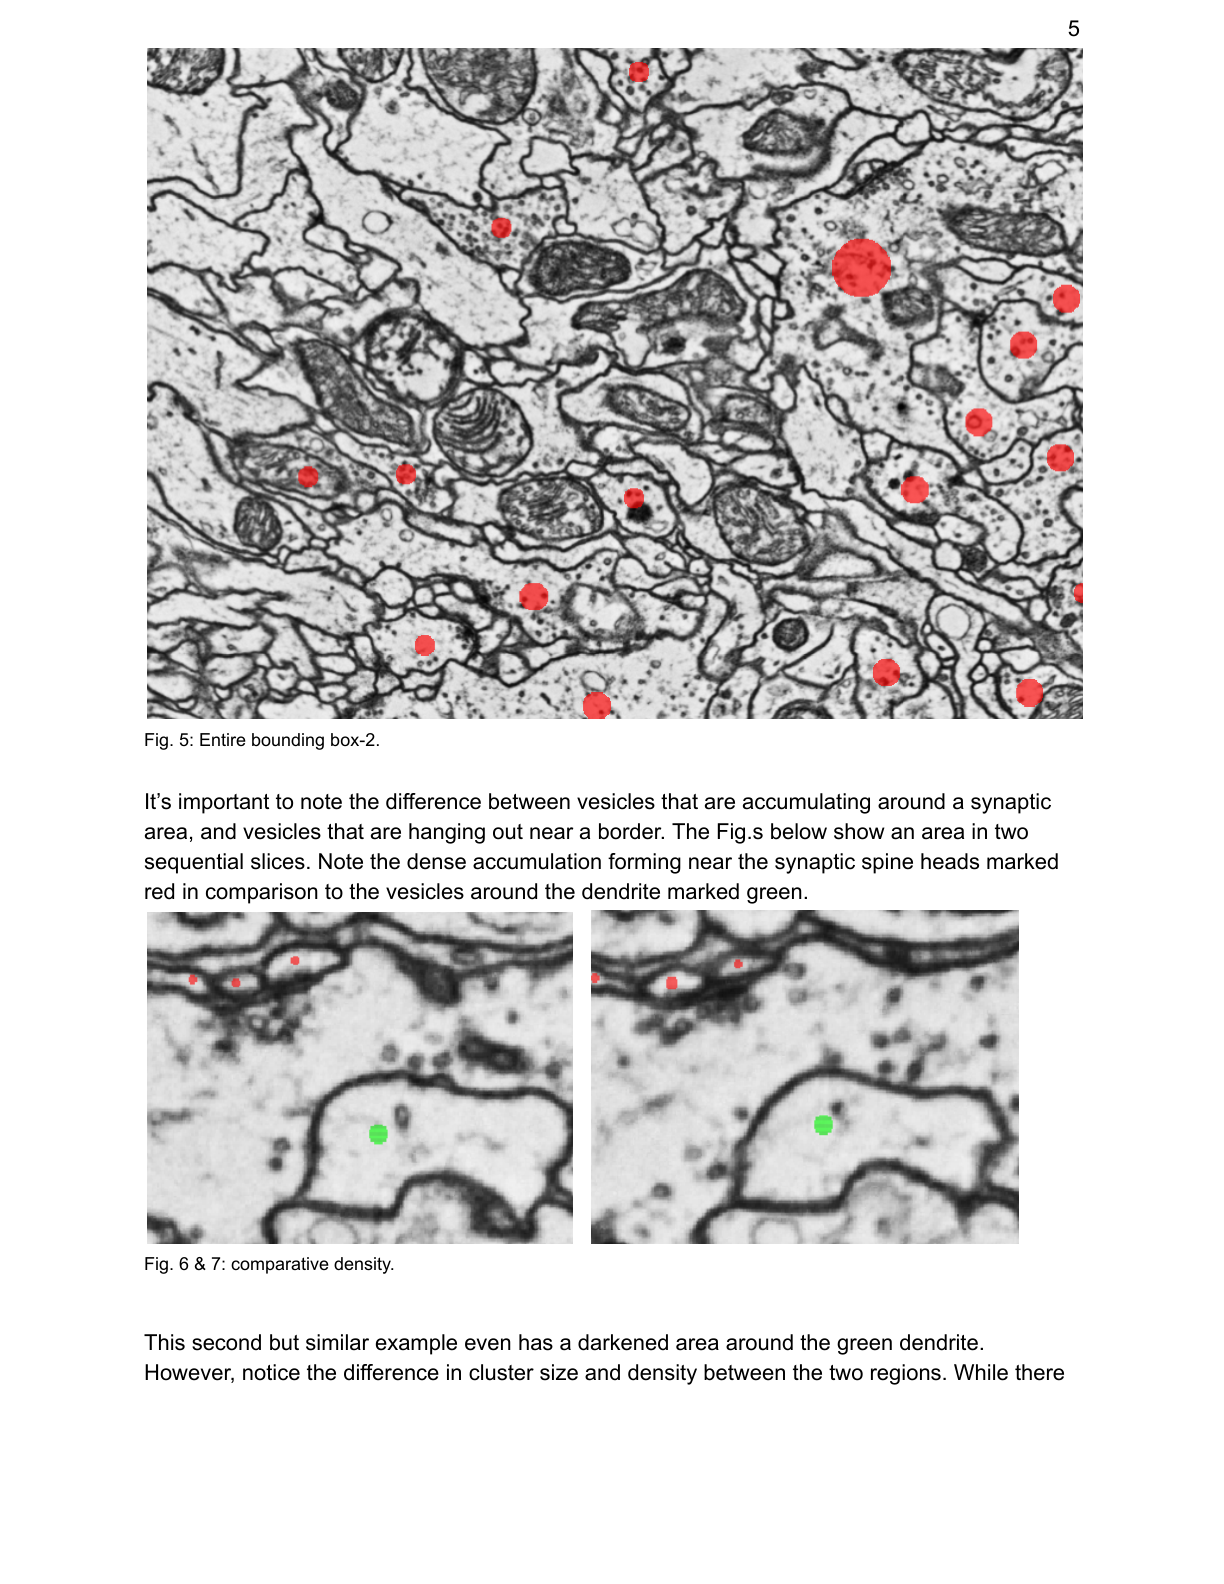
4 Vesicles A dense cluster of vesicles is one of the indicators that should be present in an identified synapse. As far as we’ve seen in fly, such clusters should be easy to spot in reasonably clear data, making them a good thing to look for when annotating synapses. In the Fig. below, how many axons can you spot with dense vesicle grouping? Fig. 4: Entire bounding box

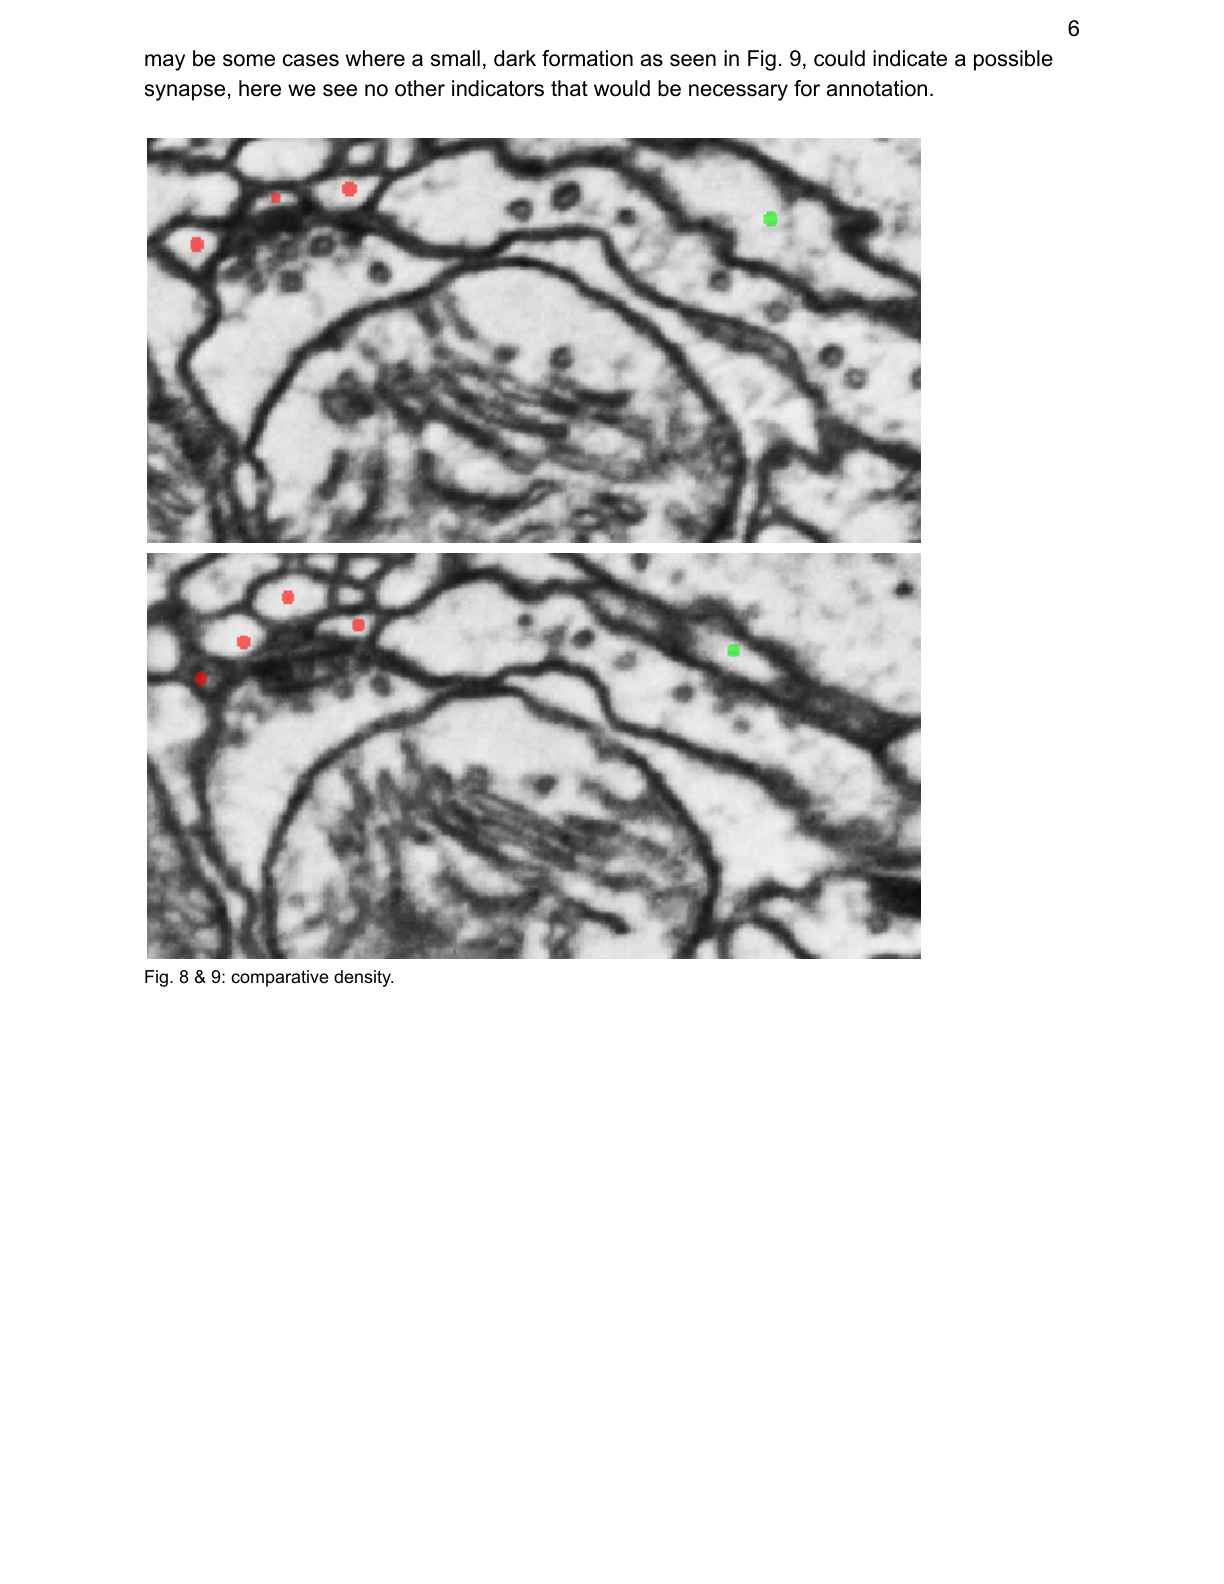
5 Fig. 5: Entire bounding box-2. It’s important to note the difference between vesicles that are accumulating around a synaptic area, and vesicles that are hanging out near a border. The Fig.s below show an area in two sequential slices. Note the dense accumulation forming near the synaptic spine heads marked red in comparison to the vesicles around the dendrite marked green. Fig. 6 & 7: comparative density. This second but similar example even has a darkened area around the green dendrite. However, notice the difference in cluster size and density between the two regions. While there

6 may be some cases where a small, dark formation as seen in Fig. 9, could indicate a possible synapse, here we see no other indicators that would be necessary for annotation. Fig. 8 & 9: comparative density.

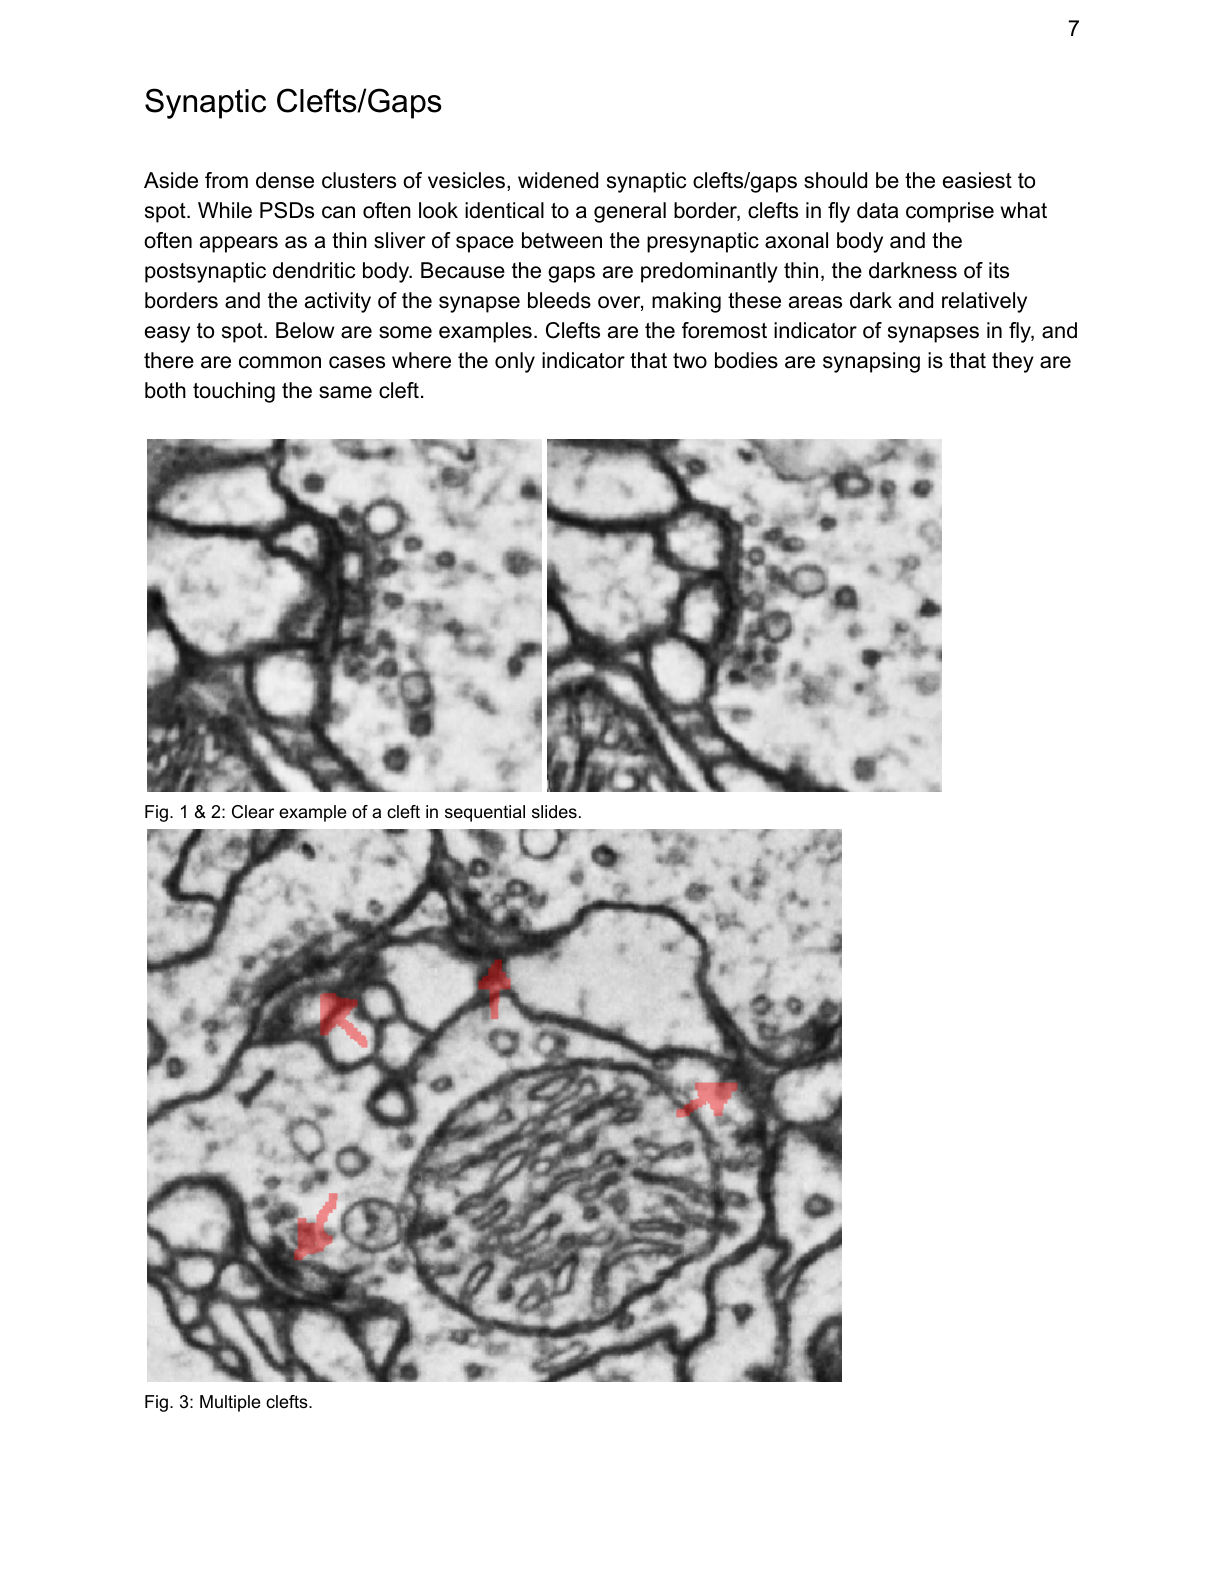
7 Synaptic Clefts/Gaps Aside from dense clusters of vesicles, widened synaptic clefts/gaps should be the easiest to spot. While PSDs can often look identical to a general border, clefts in fly data comprise what often appears as a thin sliver of space between the presynaptic axonal body and the postsynaptic dendritic body. Because the gaps are predominantly thin, the darkness of its borders and the activity of the synapse bleeds over, making these areas dark and relatively easy to spot. Below are some examples. Clefts are the foremost indicator of synapses in fly, and there are common cases where the only indicator that two bodies are synapsing is that they are both touching the same cleft. Fig. 1 & 2: Clear example of a cleft in sequential slides. Fig. 3: Multiple clefts.

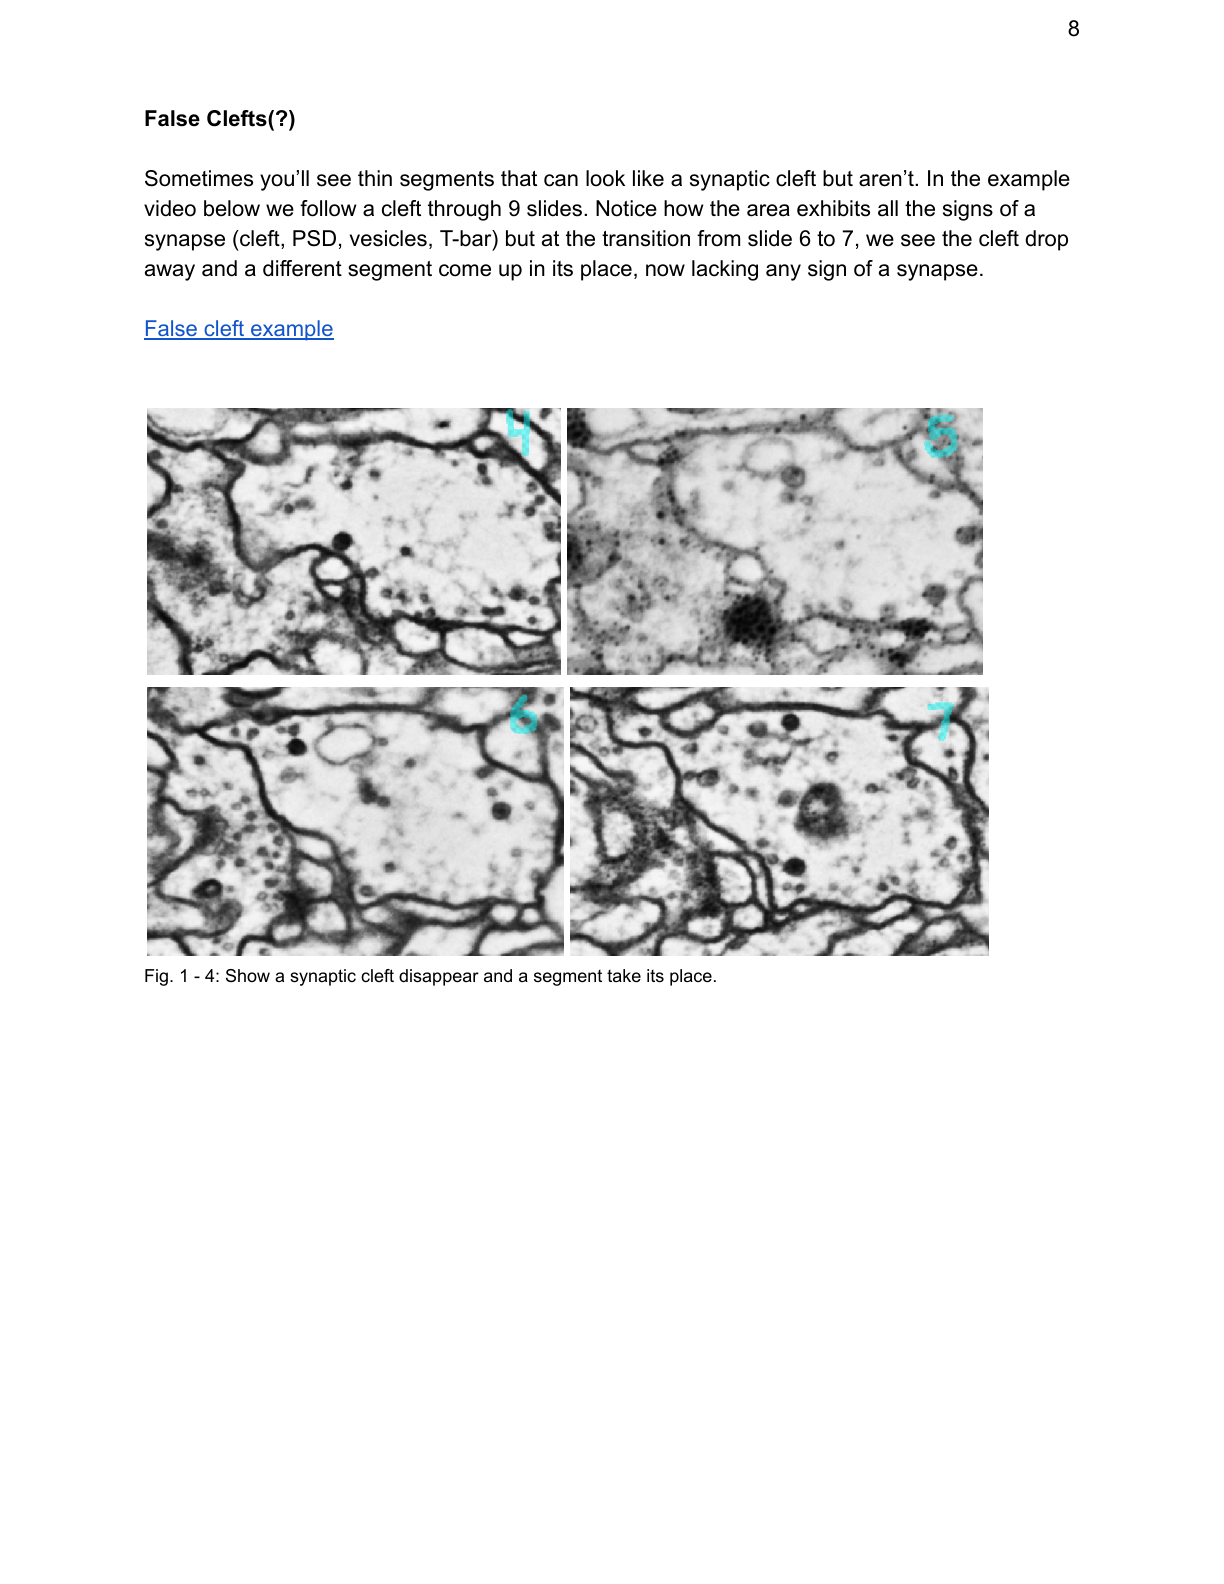
8 False Clefts(?) Sometimes you’ll see thin segments that can look like a synaptic cleft but aren’t. In the example video below we follow a cleft through 9 slides. Notice how the area exhibits all the signs of a synapse (cleft, PSD, vesicles, T-bar) but at the transition from slide 6 to 7, we see the cleft drop away and a different segment come up in its place, now lacking any sign of a synapse. False cleft example Fig. 1 - 4: Show a synaptic cleft disappear and a segment take its place.

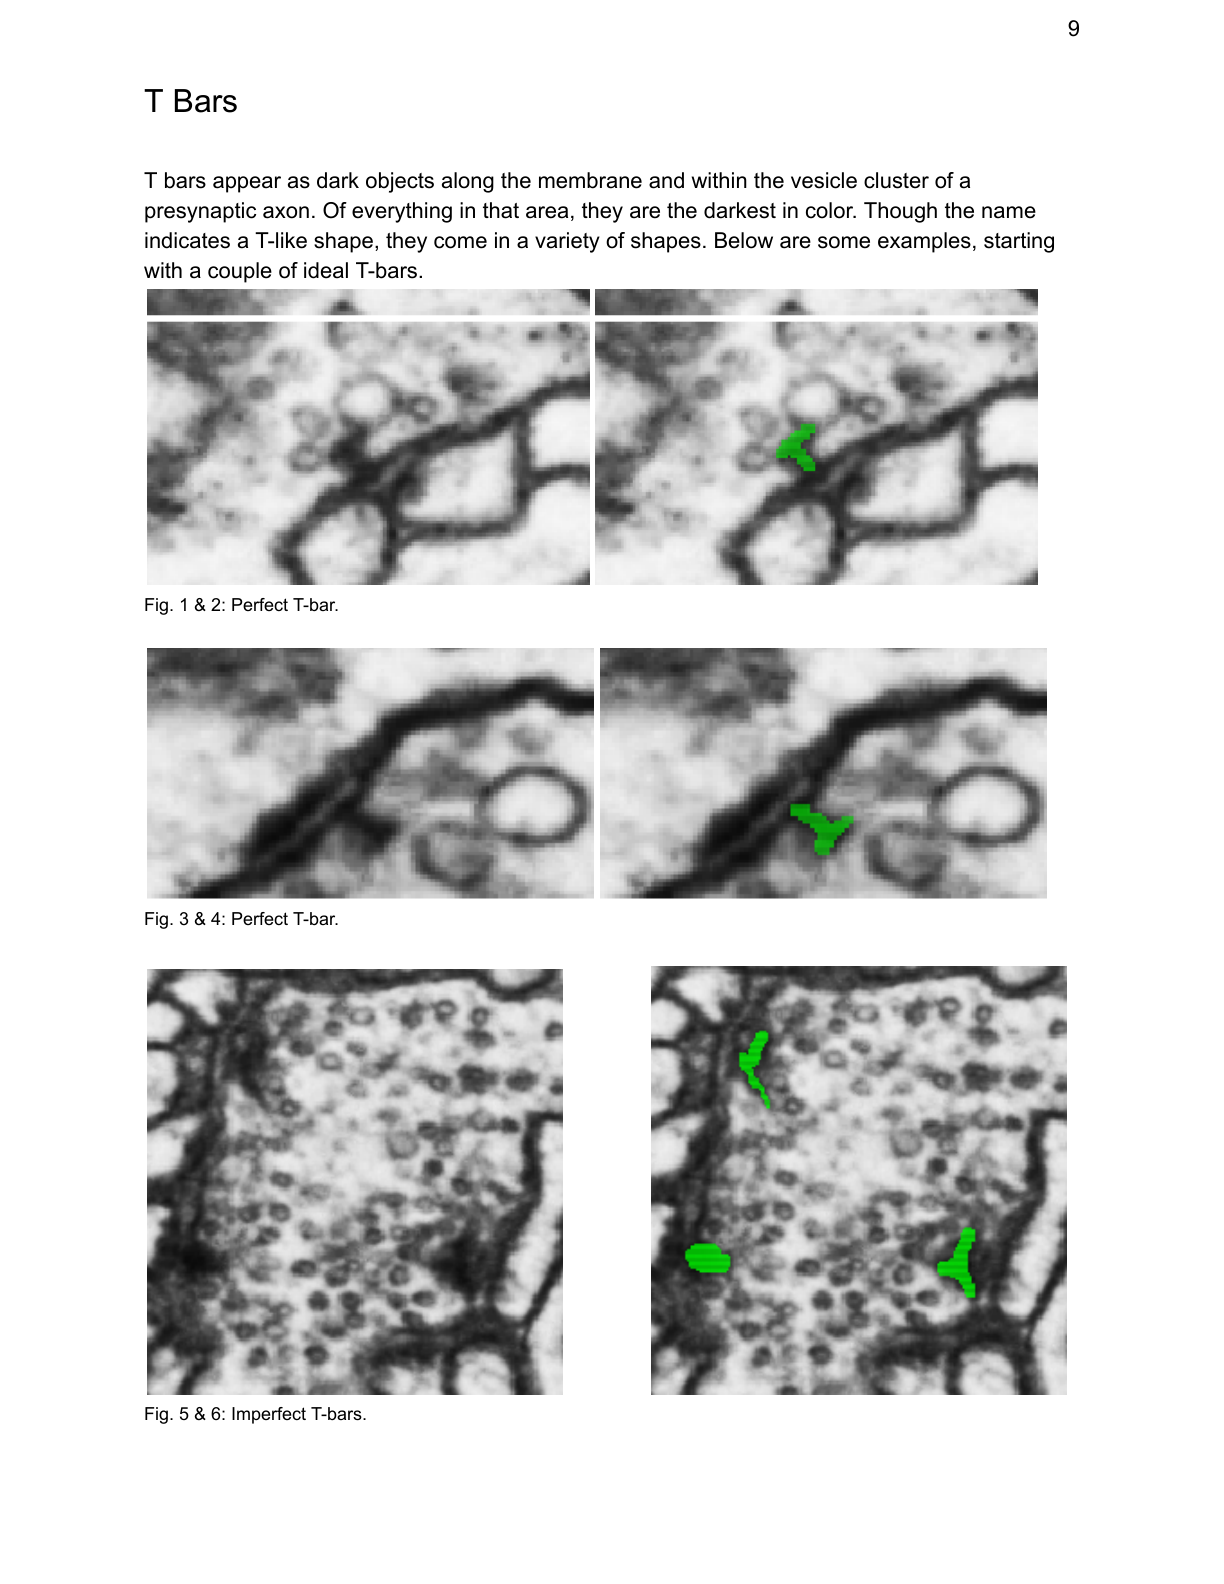
9 T Bars T bars appear as dark objects along the membrane and within the vesicle cluster of a presynaptic axon. Of everything in that area, they are the darkest in color. Though the name indicates a T-like shape, they come in a variety of shapes. Below are some examples, starting with a couple of ideal T-bars. Fig. 1 & 2: Perfect T-bar. Fig. 3 & 4: Perfect T-bar. Fig. 5 & 6: Imperfect T-bars.

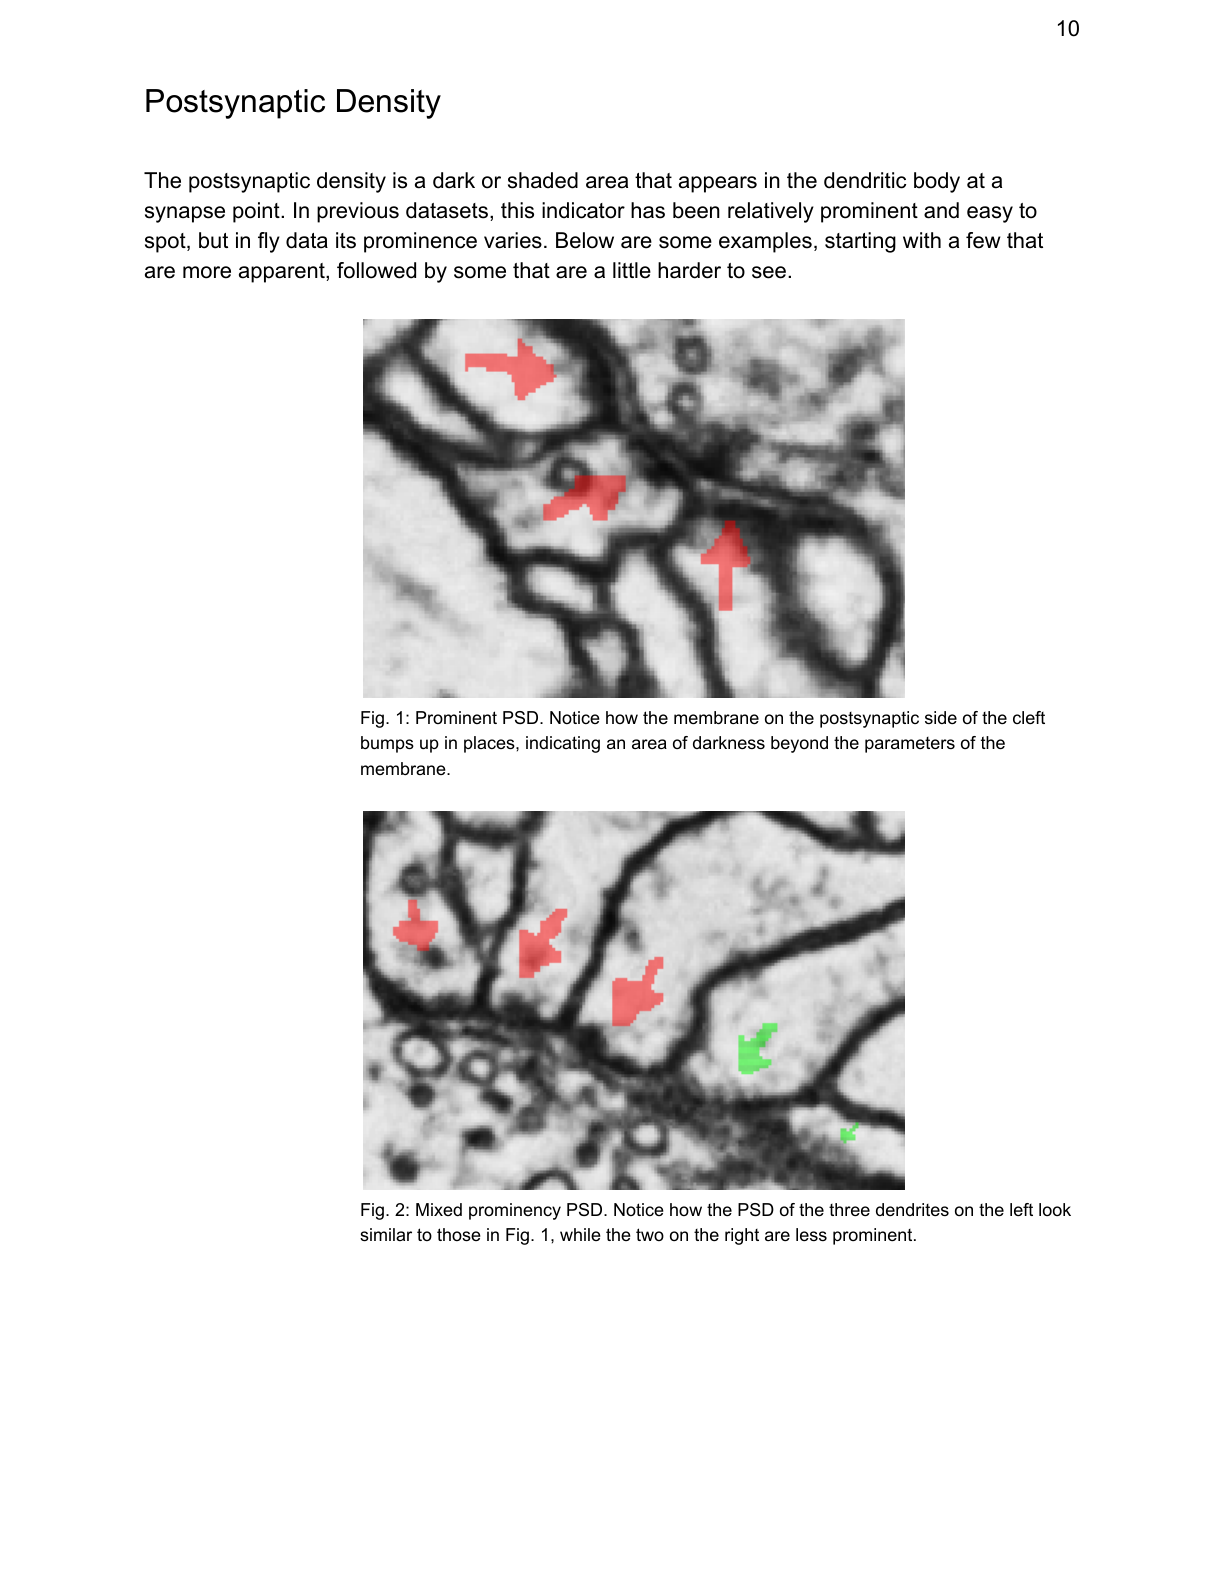
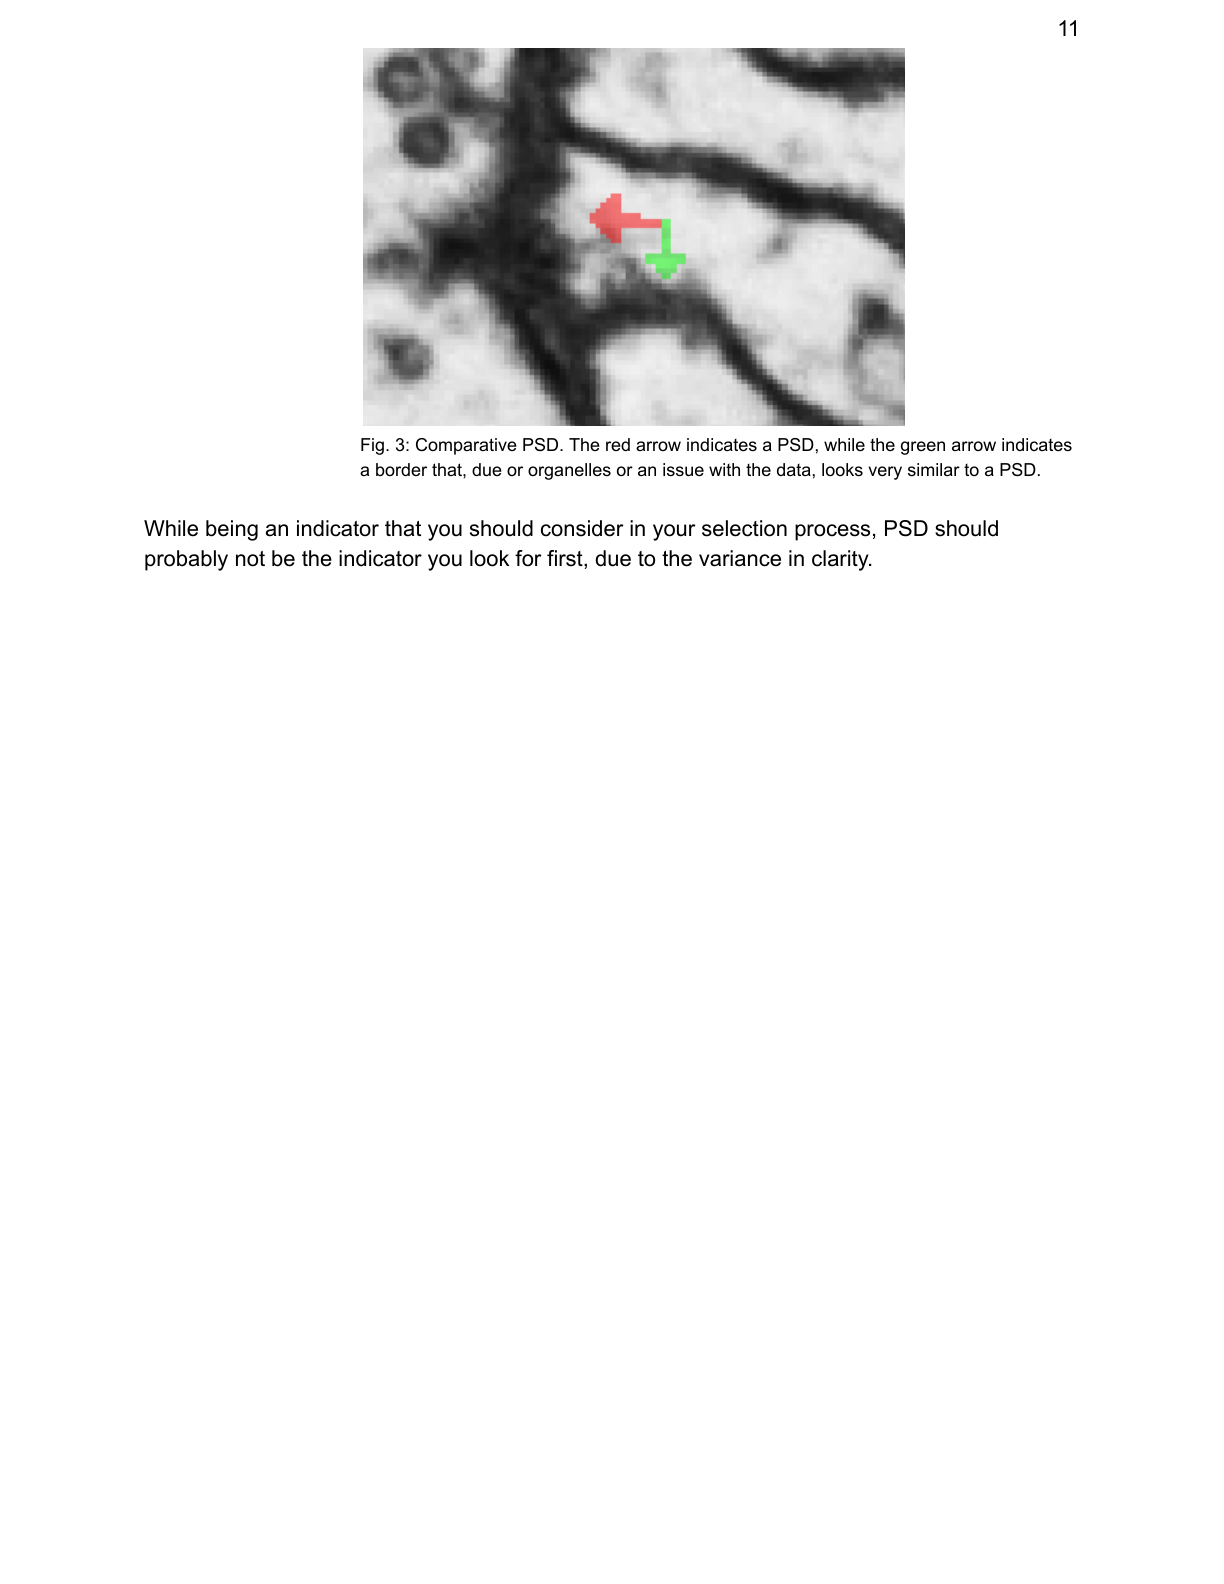
10 Postsynaptic Density The postsynaptic density is a dark or shaded area that appears in the dendritic body at a synapse point. In previous datasets, this indicator has been relatively prominent and easy to spot, but in fly data its prominence varies. Below are some examples, starting with a few that are more apparent, followed by some that are a little harder to see. Fig. 1: Prominent PSD. Notice how the membrane on the postsynaptic side of the cleft bumps up in places, indicating an area of darkness beyond the parameters of the membrane. Fig. 2: Mixed prominency PSD. Notice how the PSD of the three dendrites on the left look similar to those in Fig. 1, while the two on the right are less prominent.

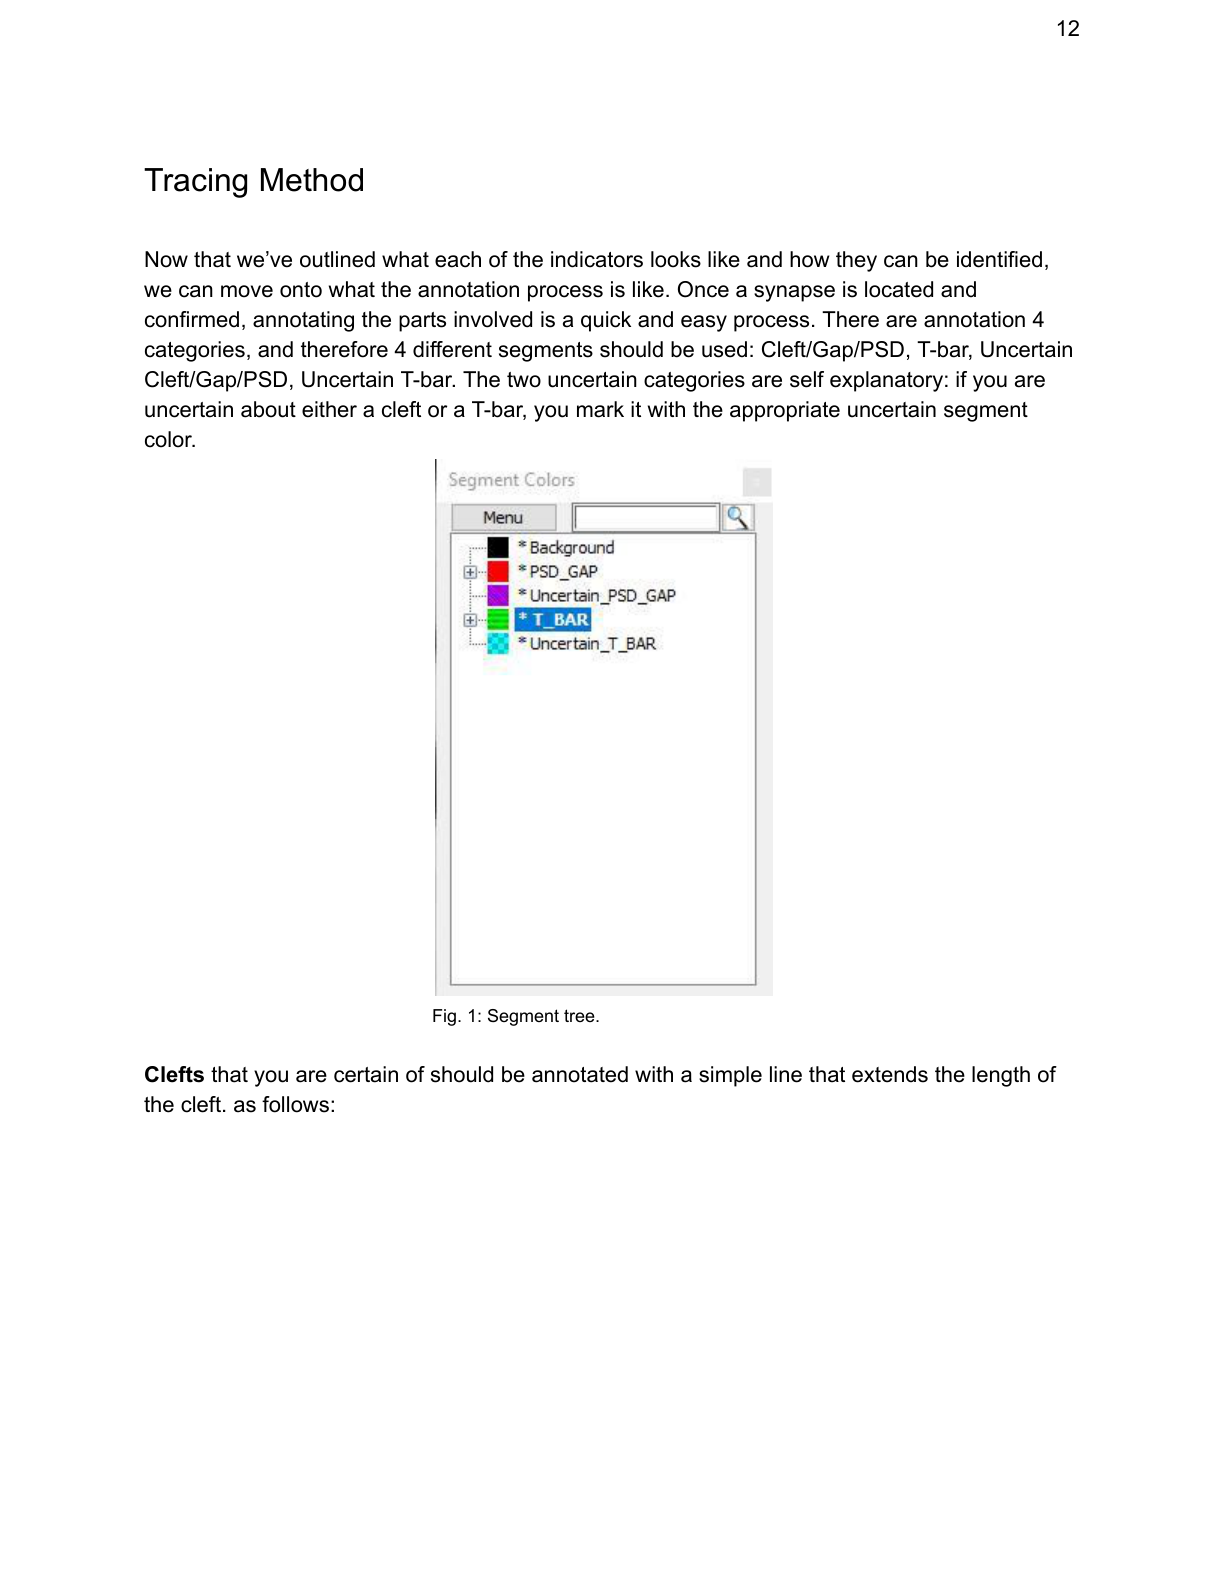
11 Fig. 3: Comparative PSD. The red arrow indicates a PSD, while the green arrow indicates a border that, due or organelles or an issue with the data, looks very similar to a PSD. While being an indicator that you should consider in your selection process, PSD should probably not be the indicator you look for first, due to the variance in clarity.

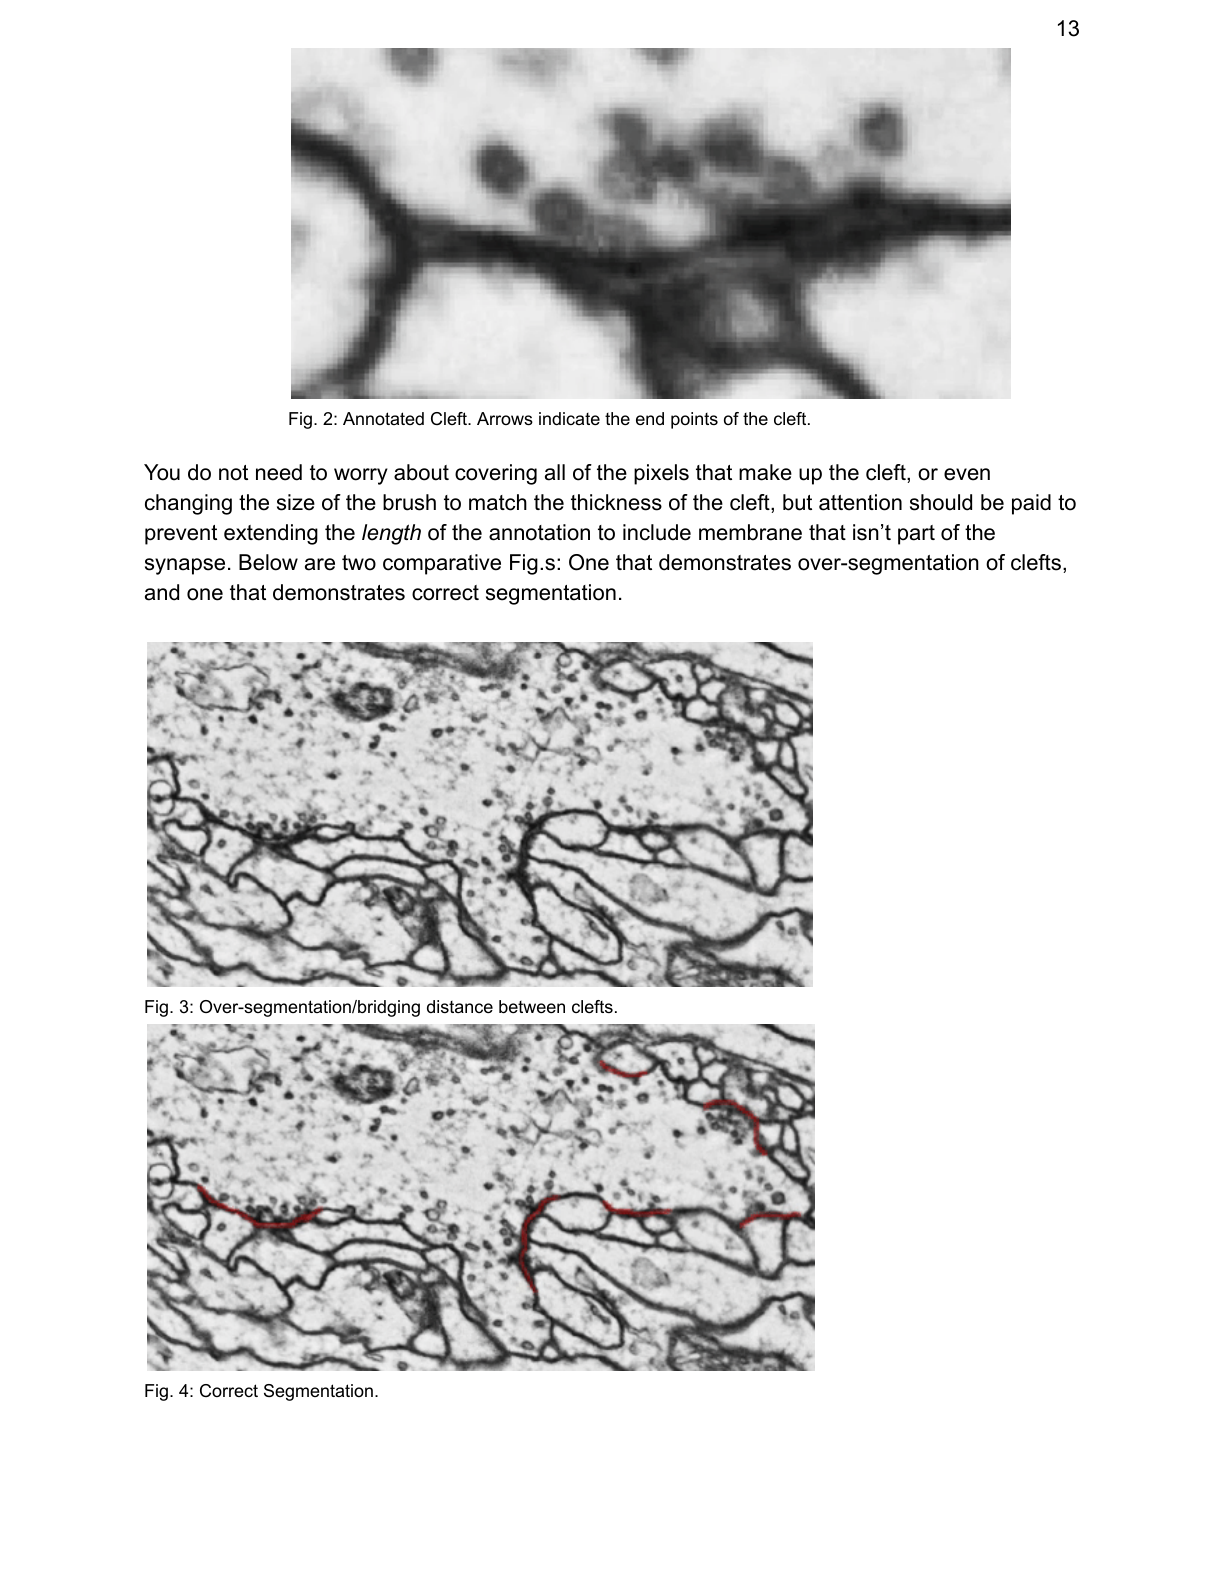
12 Tracing Method Now that we’ve outlined what each of the indicators looks like and how they can be identified, we can move onto what the annotation process is like. Once a synapse is located and confirmed, annotating the parts involved is a quick and easy process. There are annotation 4 categories, and therefore 4 different segments should be used: Cleft/Gap/PSD, T-bar, Uncertain Cleft/Gap/PSD, Uncertain T-bar. The two uncertain categories are self explanatory: if you are uncertain about either a cleft or a T-bar, you mark it with the appropriate uncertain segment color. Fig. 1: Segment tree. Clefts that you are certain of should be annotated with a simple line that extends the length of the cleft. as follows:

13 Fig. 2: Annotated Cleft. Arrows indicate the end points of the cleft. You do not need to worry about covering all of the pixels that make up the cleft, or even changing the size of the brush to match the thickness of the cleft, but attention should be paid to prevent extending the length of the annotation to include membrane that isn’t part of the synapse. Below are two comparative Fig.s: One that demonstrates over-segmentation of clefts, and one that demonstrates correct segmentation. Fig. 3: Over-segmentation/bridging distance between clefts. Fig. 4: Correct Segmentation.

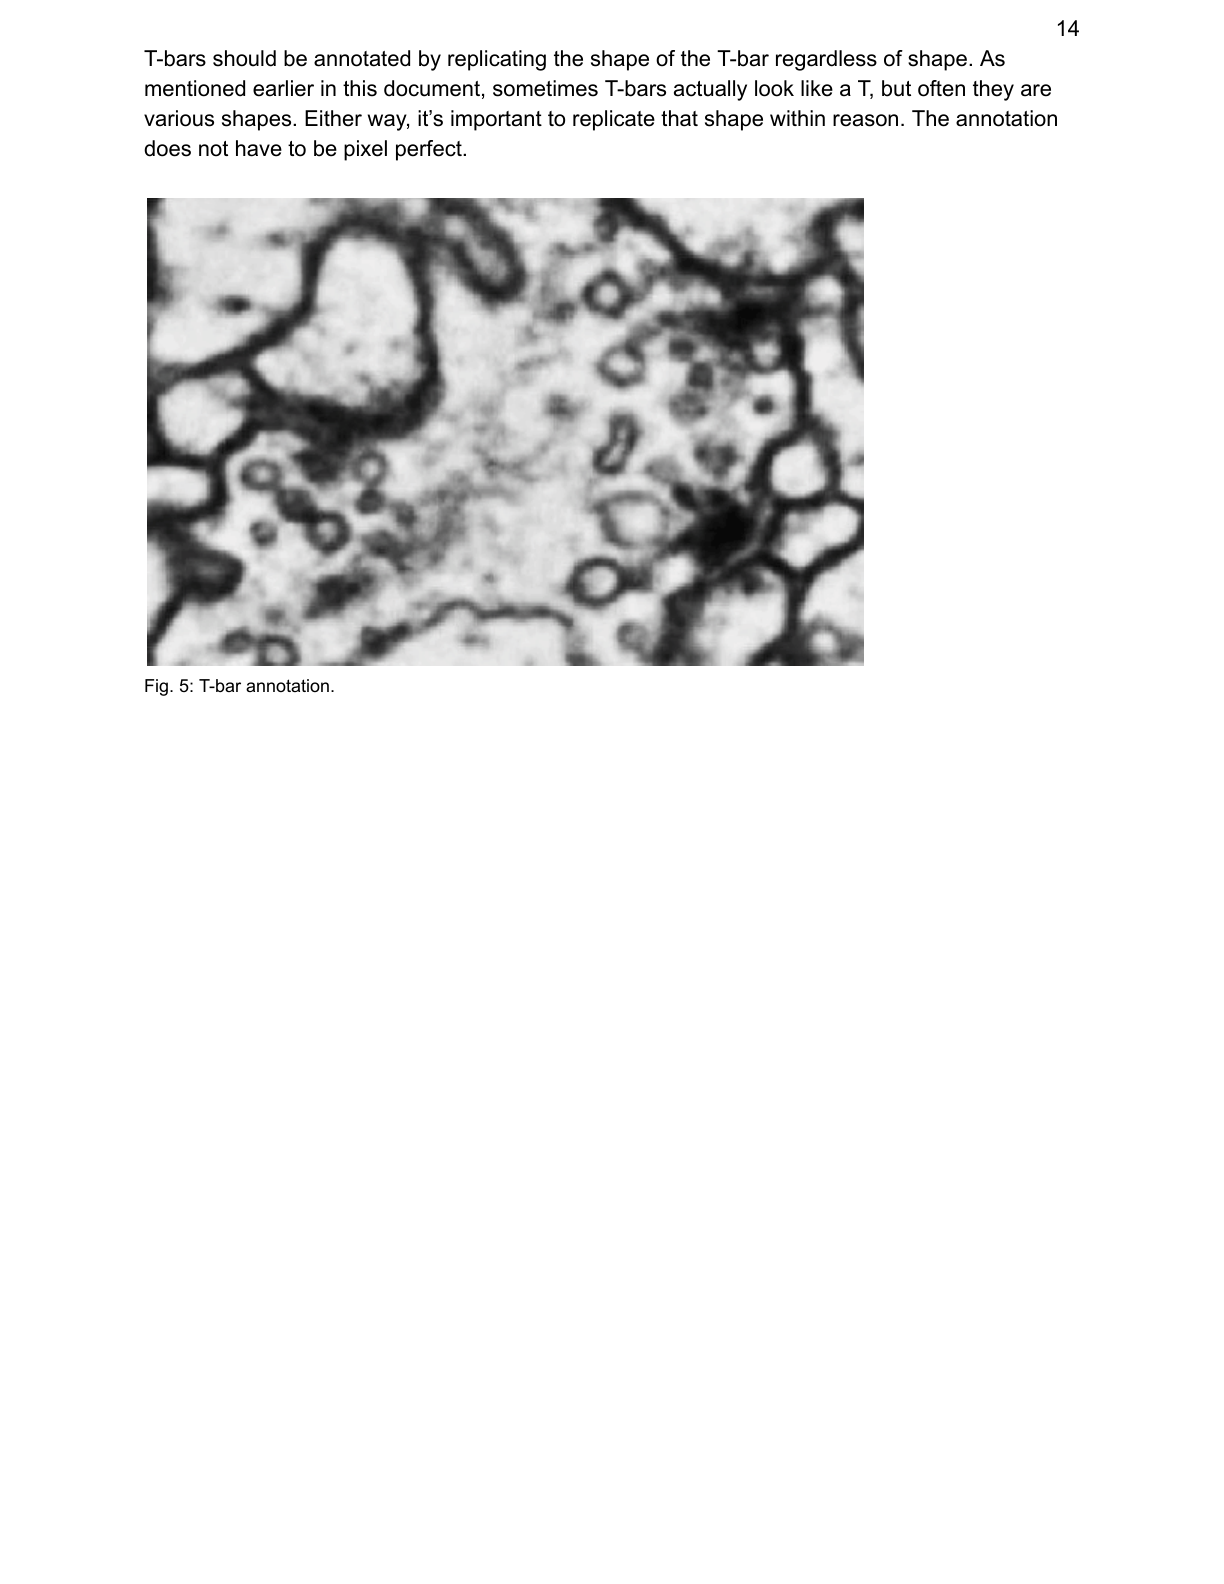
14 T-bars should be annotated by replicating the shape of the T-bar regardless of shape. As mentioned earlier in this document, sometimes T-bars actually look like a T, but often they are various shapes. Either way, it’s important to replicate that shape within reason. The annotation does not have to be pixel perfect. Fig. 5: T-bar annotation.

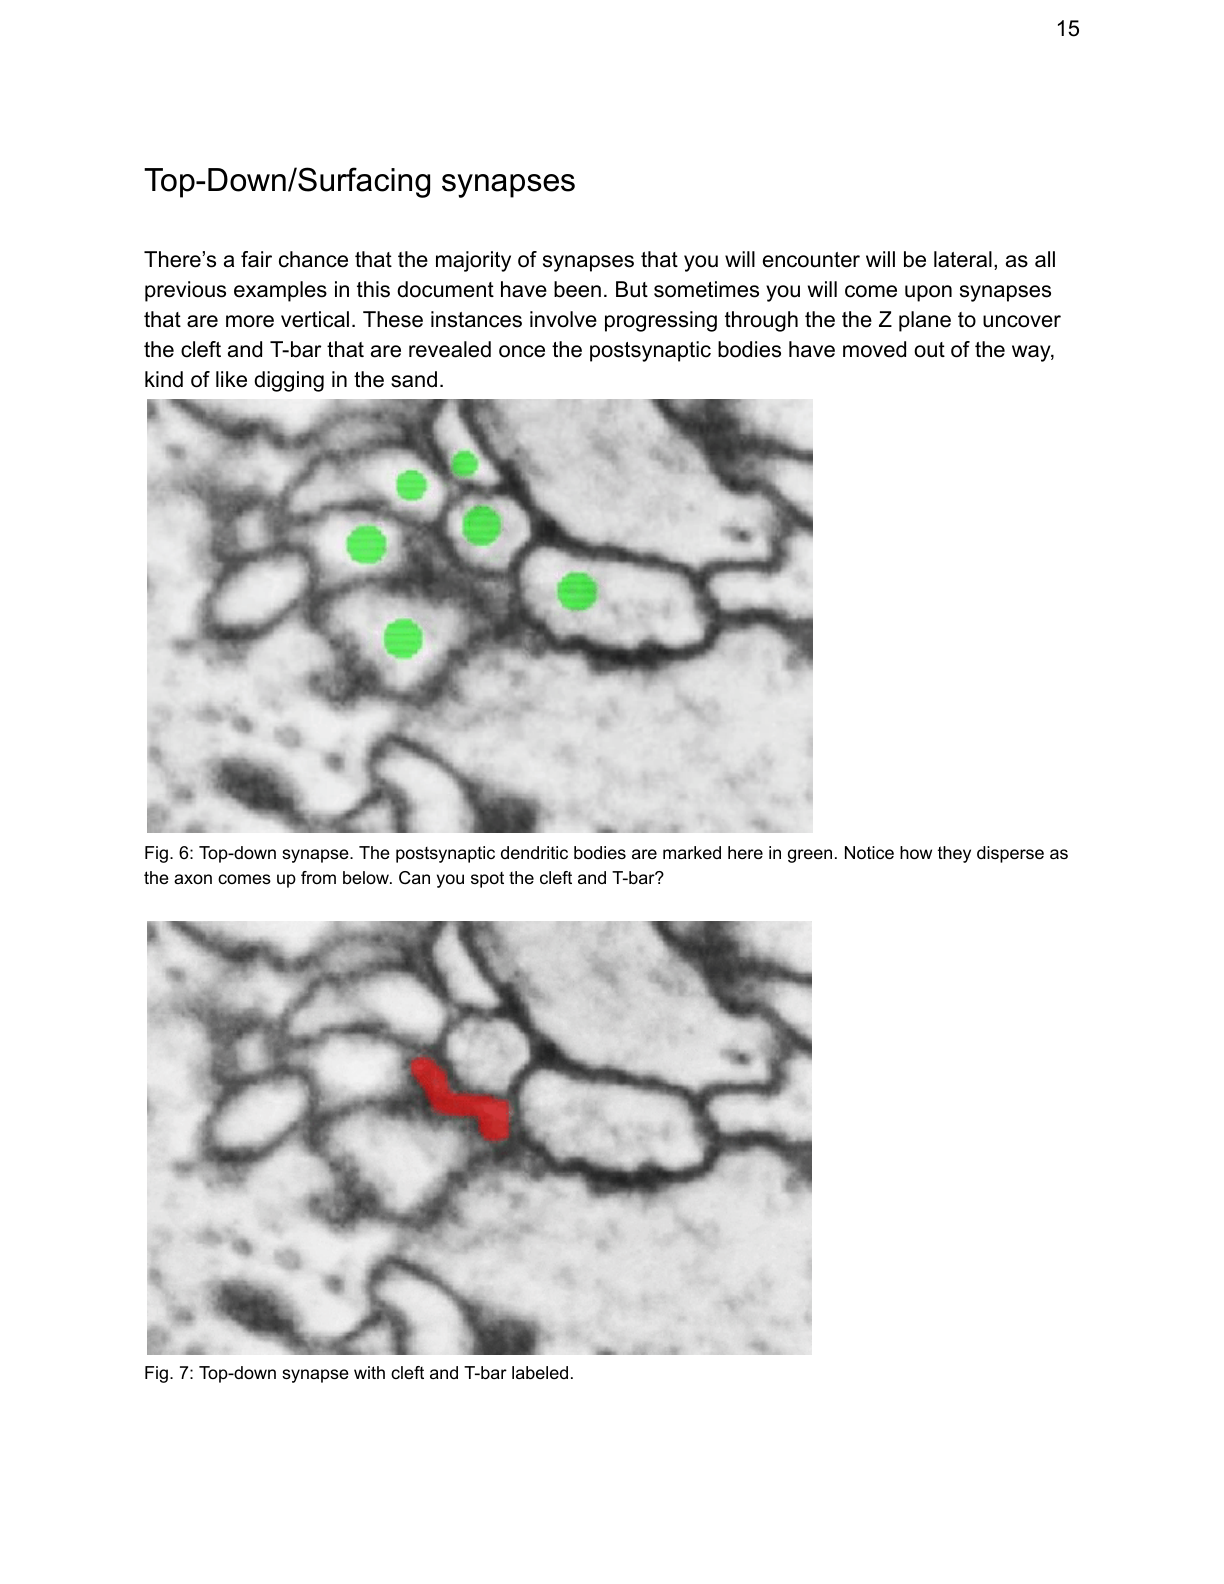
15 Top-Down/Surfacing synapses There’s a fair chance that the majority of synapses that you will encounter will be lateral, as all previous examples in this document have been. But sometimes you will come upon synapses that are more vertical. These instances involve progressing through the the Z plane to uncover the cleft and T-bar that are revealed once the postsynaptic bodies have moved out of the way, kind of like digging in the sand. Fig. 6: Top-down synapse. The postsynaptic dendritic bodies are marked here in green. Notice how they disperse as the axon comes up from below. Can you spot the cleft and T-bar? Fig. 7: Top-down synapse with cleft and T-bar labeled.